

About Bitcoin
After Bitcoin ETFs were approved by the SEC, the price of Bitcoin rose almost 60% to $73,777. The market thought that the price of Bitcoin would go to $100,000 without correction, but contrary to the market’s expectation,the Bitcoin price was in a correction phase for 6 months, and after almost 6 months and the re-election of Trump as President of the United States, Bitcoin returned to its upward trend.
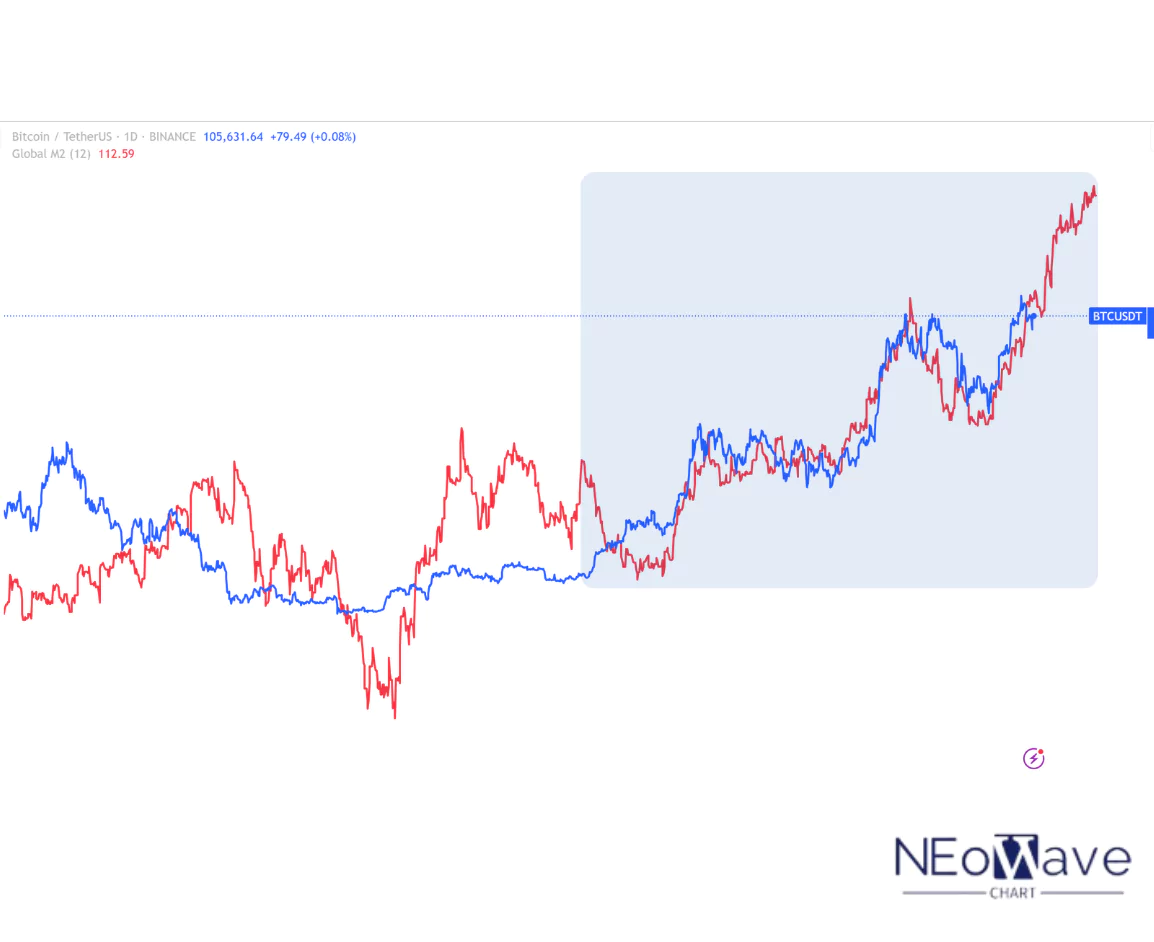
Bitcoin and Global M2 Correlation
The correlation between the Bitcoin chart and the Global M2 (global money supply) index indicates a positive relationship in the long term, which is significant for both novice and professional analysts. As the global M2 increases, reflecting liquidity growth due to expansive monetary policies by central banks, demand for high-risk assets like Bitcoin rises. This correlation stems from investors’ desire to preserve the value of their assets against inflation caused by rising liquidity. However, this relationship may be weakened in the short term by factors such as market sentiment, regulations, or unexpected events (like political or economic conflicts).
Since 2024, the price patterns of Bitcoin have shown a remarkable similarity to the growth of Global M2. This correlation could result from global liquidity injections that have driven investors toward riskier assets. For instance, the price surges of Bitcoin in late 2024 and early 2025 have coincided with increases in M2, a trend observable in the provided chart.
This chart aligns with the medium- and long-term analyses I previously shared, suggesting it presents a promising investment opportunity. In my view, the winner in the Bitcoin game is someone who opts for long-term investment rather than short-term trading or speculation. Long-term investment allows you to overlook short-term fluctuations—caused by various factors, such as the recent conflict between Trump and Elon Musk—and avoid unnecessary stress or false excitement. However, if you intend to engage in short-term trading, never neglect risk and capital management.
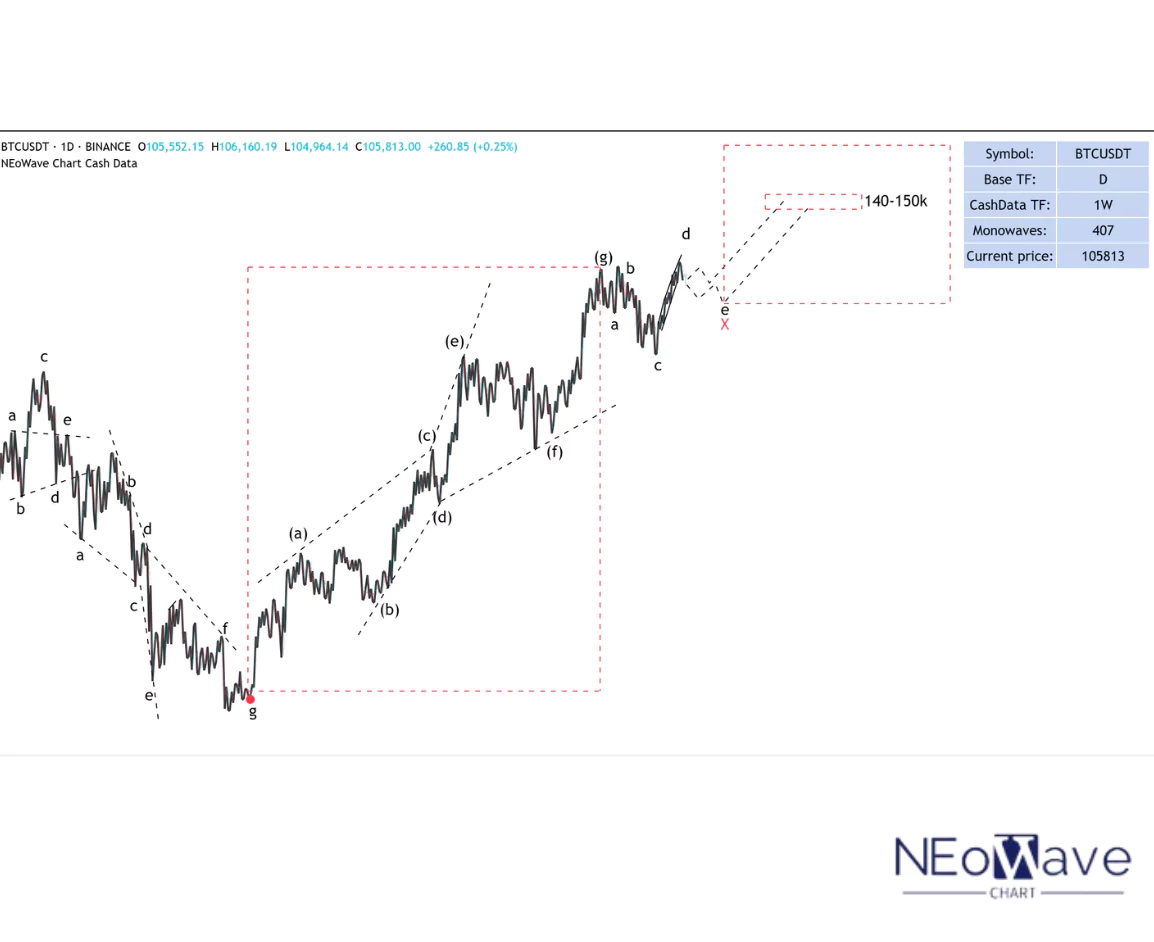
Bitcoin Forecast by NEoWave(Update5)
In our previous analyses, we outlined two scenarios:
1. The formation of a combination pattern with a small X-wave following a bow-tie diametric.
2. A break below the support zone leading to a price drop to $49,000.
However, it was noted in the same analysis that the first scenario was more likely, and as long as the price remains above $70,000, Bitcoin could rise to the $140,000–$150,000 range.
The first scenario has unfolded as expected, but the movement following the small X-wave lacked the strength of a new upward wave. Upon further completion of this wave, we realized that a larger pattern is currently forming.
At present, the scenario of a combination pattern with a small X-wave remains valid, with the difference that the X-wave is evolving into a neutral triangle. After this, we can anticipate a price increase toward the $140,000–$150,000 range.
Good luck
NEoWaveChart
Disclaimer
All wave counts, analyses, and forecasts presented on this website are produced by NEoWave Chart and operate independently of NEoWave, Inc and www.NEoWave.com.
Our content is strictly based on the NEoWave methodology developed by Glenn Neely, adhering to his innovative techniques and principles.