About Ethereum
Ethereum is a decentralized network that uses blockchain technology to run applications and process transactions. It has its own native cryptocurrency, called Ether (ETH), which is primarily used to secure the network and pay transaction fees. Ethereum’s network protocols are open-source, meaning anyone can create smart contracts or decentralized applications (dApps) by writing code. Smart contracts and dApps are concepts that emerged with Ethereum’s introduction to the blockchain world.


Ethereum Forecast by NEoWave
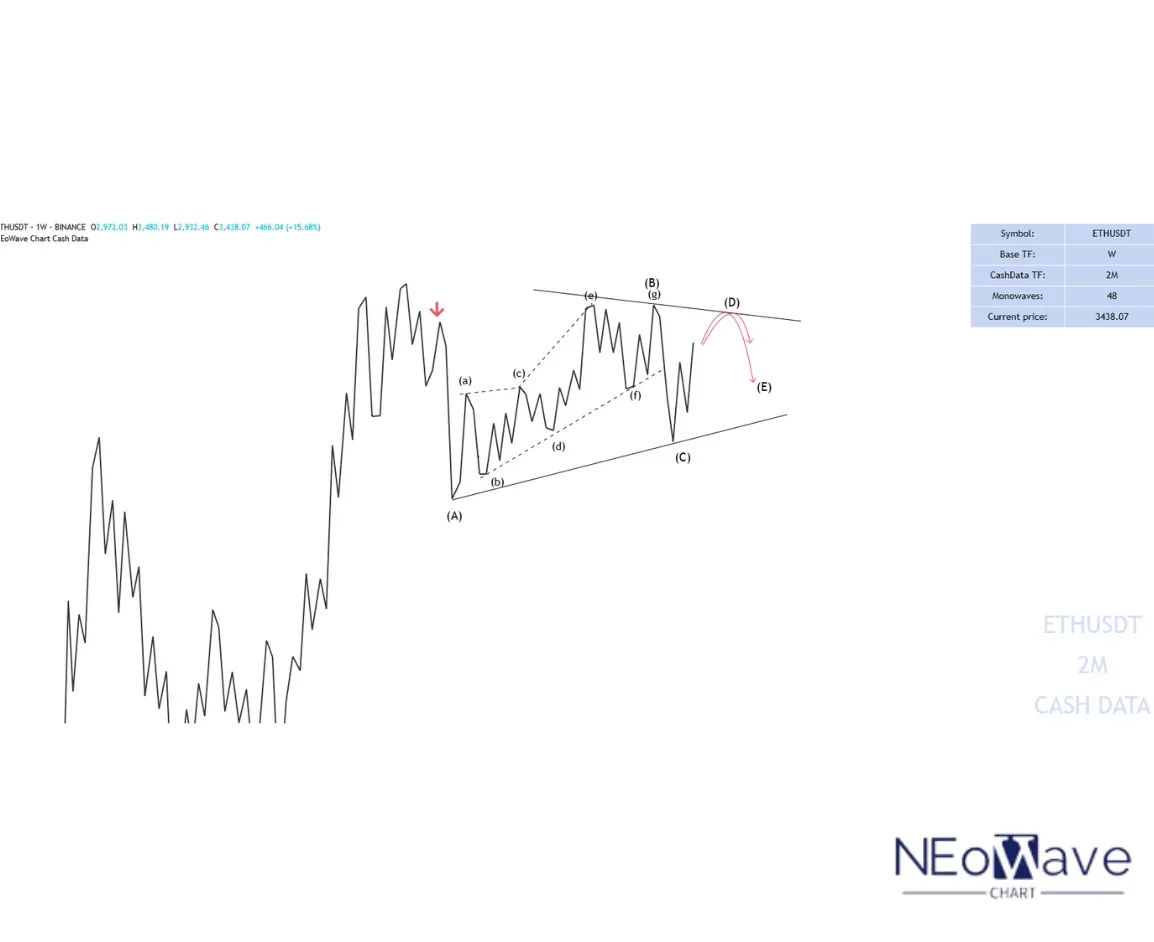
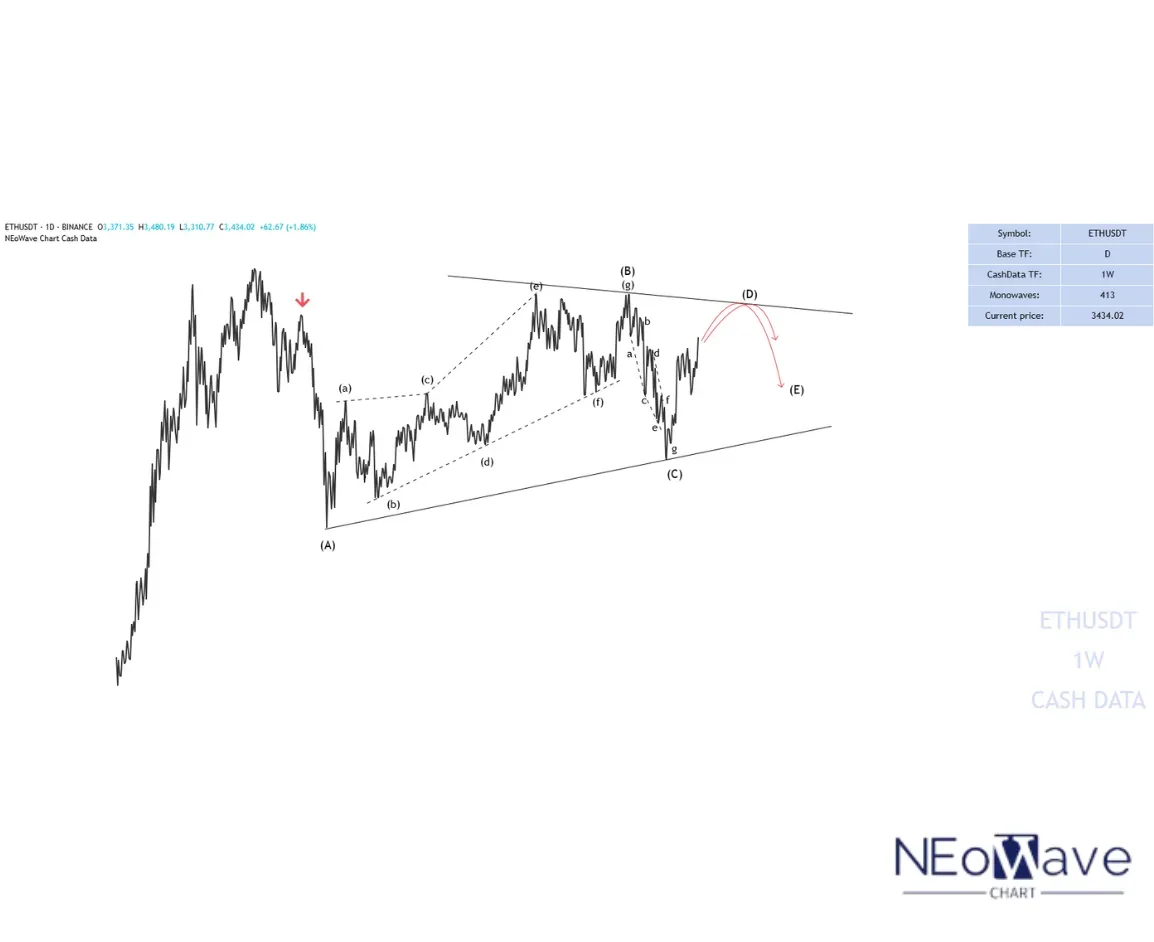
The 2-month cash data chart shows that Ethereum is in a corrective phase and the wave structure from (A) to (C) has been completed. Initially, we expected a flat pattern to form; however, the wave structure-(C) was not an impulse and the flat was not confirmed.
As a result, given that the wave structure (A)-(B)-(C) is corrective and the waves differ in time, it seems that a contracting triangle pattern is forming and we are currently in wave-(D) of this triangle. Furthermore, wave-(D) could rise to $3630-3880 and end. Then a price correction in the form of wave-(E) may occur. This correction could end between $2900-3086 and if this range is broken downwards, wave-(E) could decline to $2000-2230, after which the main bullish move for Ethereum is expected to begin.
Good luck
NEoWaveChart
Disclaimer
All wave counts, analyses, and forecasts presented on this website are produced by NEoWave Chart and operate independently of NEoWave, Inc and www.NEoWave.com.
Our content is strictly based on the NEoWave methodology developed by Glenn Neely, adhering to his innovative techniques and principles.


