About Ethereum
Ethereum is a decentralized network that uses blockchain technology to run applications and process transactions. It has its own native cryptocurrency, called Ether (ETH), which is primarily used to secure the network and pay transaction fees. Ethereum’s network protocols are open-source, meaning anyone can create smart contracts or decentralized applications (dApps) by writing code. Smart contracts and dApps are concepts that emerged with Ethereum’s introduction to the blockchain world.

Ethereum Forecast by NEoWave
1M Cash Data Chart
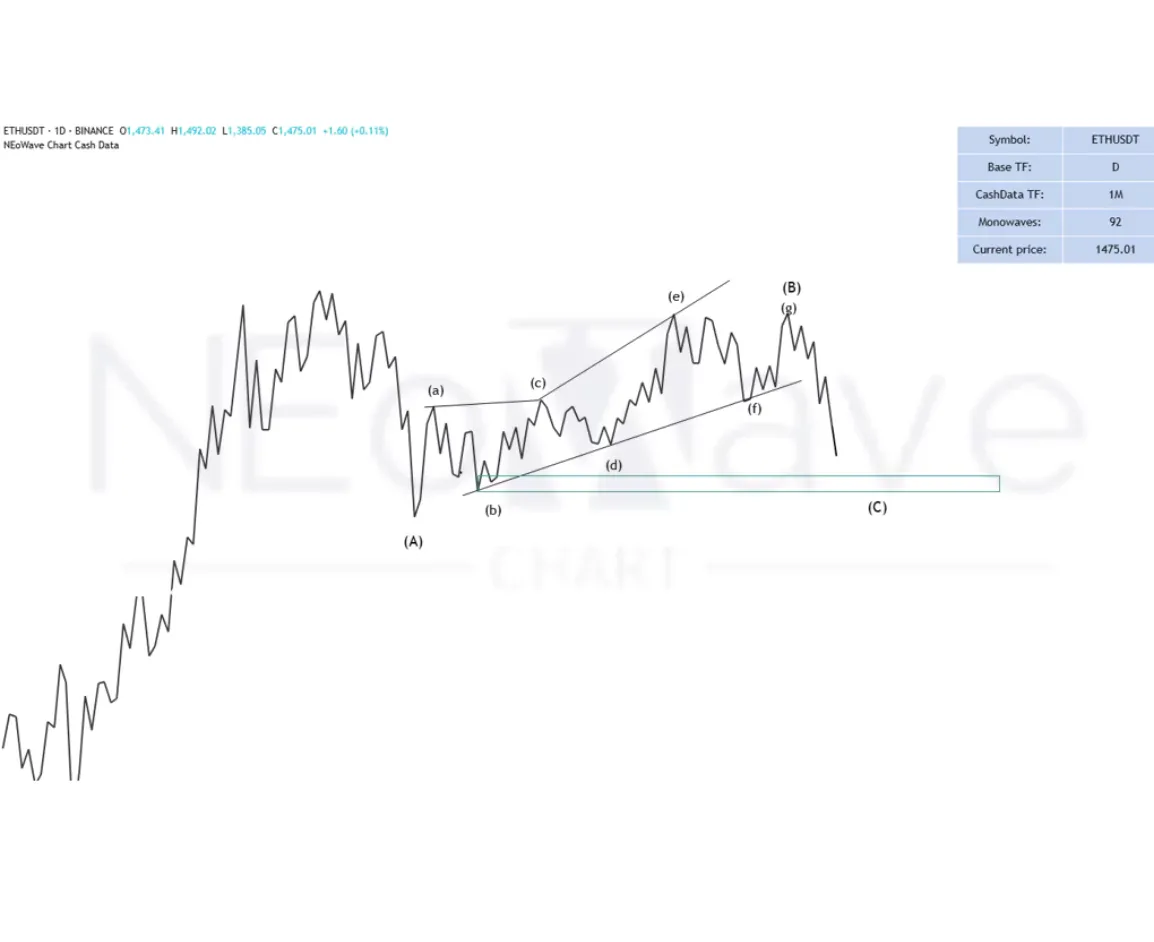
Ethereum fell to $1,400 after growing almost 4x in the form of a diametric.
Based on the price size of wave-B, it appears that a flat pattern with a regular wave-B is forming. In this pattern, wave -C typically retraces the entirety of wave -B, though a flat with a C-failure may occur at times.
Our primary scenario suggests that wave -C could conclude within the 1000–1200 range, indicating a flat with a C -failure. However, if the price breaks strongly through the 1000–1200 range and consolidates below this level, wave-C might extend to the 700–807 range.
Good luck
NEoWaveChart


