
About Nifty 50
The NIFTY 50 is the flagship index on the National Stock Exchange of India Ltd. (NSE). The Index tracks the behavior of a portfolio of blue chip companies, the largest and most liquid Indian securities. It includes 50 of the approximately 1600 companies listed on the NSE, captures approximately 65% of its float-adjusted market capitalization and is a true reflection of the Indian stock market.
The NIFTY 50 covers major sectors of the Indian economy and offers investment managers exposure to the Indian market in one efficient portfolio. The Index has been trading since April 1996 and is well suited for benchmarking, index funds and index-based derivatives.
Nifty 50 Forecast by NEoWave(Update)
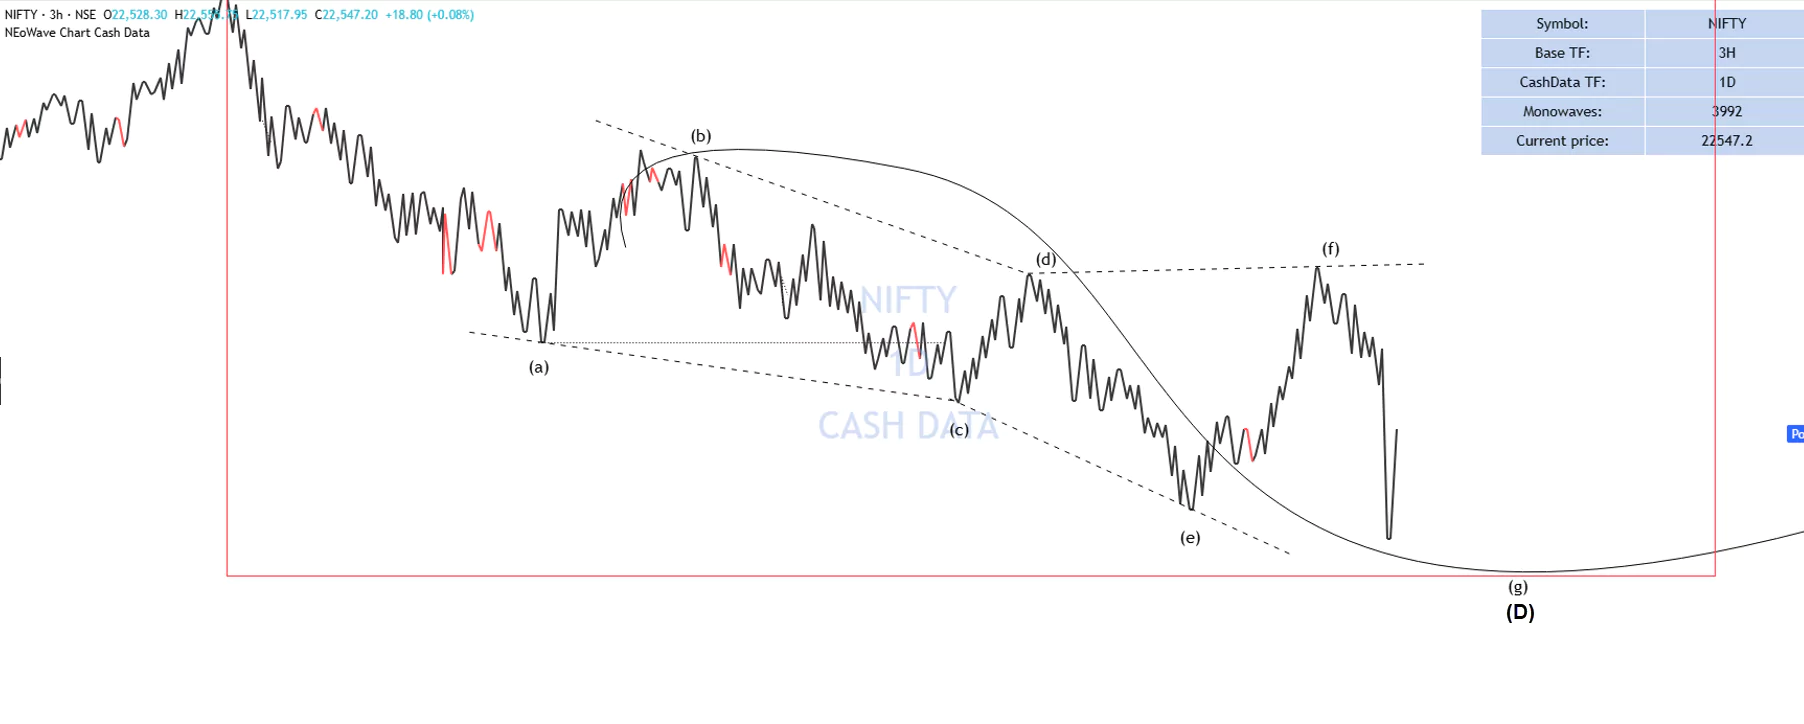
While many analysts thought that the NIFTY50 correction was over, the index is still moving towards the specified targets. The reason I did not update the index was that we had not yet received confirmations of the end of the correction.
It seems that the minimum target for the NIFTY50 index is the same number as I mentioned earlier and after reaching the target, we will check whether the correction is over or will continue to decline.
The pattern is still diametric and we only changed the position of the labels (c)-(d)-(e). If 23879 is broken strongly, we can say that the NIFTY50 correction is over.
Good luck
NEoWave Chart