About Nifty 50
The NIFTY 50 is the flagship index on the National Stock Exchange of India Ltd. (NSE). The Index tracks the behavior of a portfolio of blue chip companies, the largest and most liquid Indian securities. It includes 50 of the approximately 1600 companies listed on the NSE, captures approximately 65% of its float-adjusted market capitalization and is a true reflection of the Indian stock market.
The NIFTY 50 covers major sectors of the Indian economy and offers investment managers exposure to the Indian market in one efficient portfolio. The Index has been trading since April 1996 and is well suited for benchmarking, index funds and index-based derivatives.


Nifty 50 Forecast with NEoWave
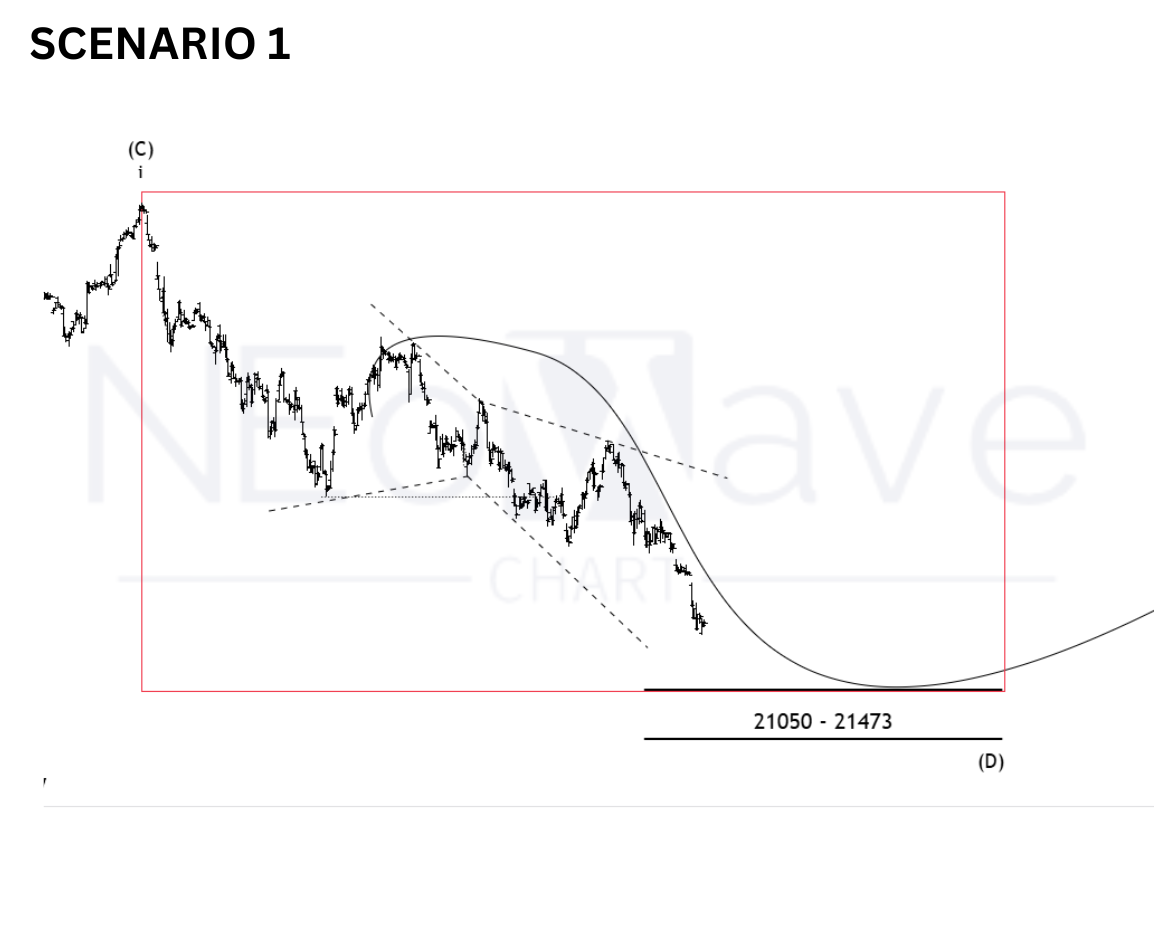
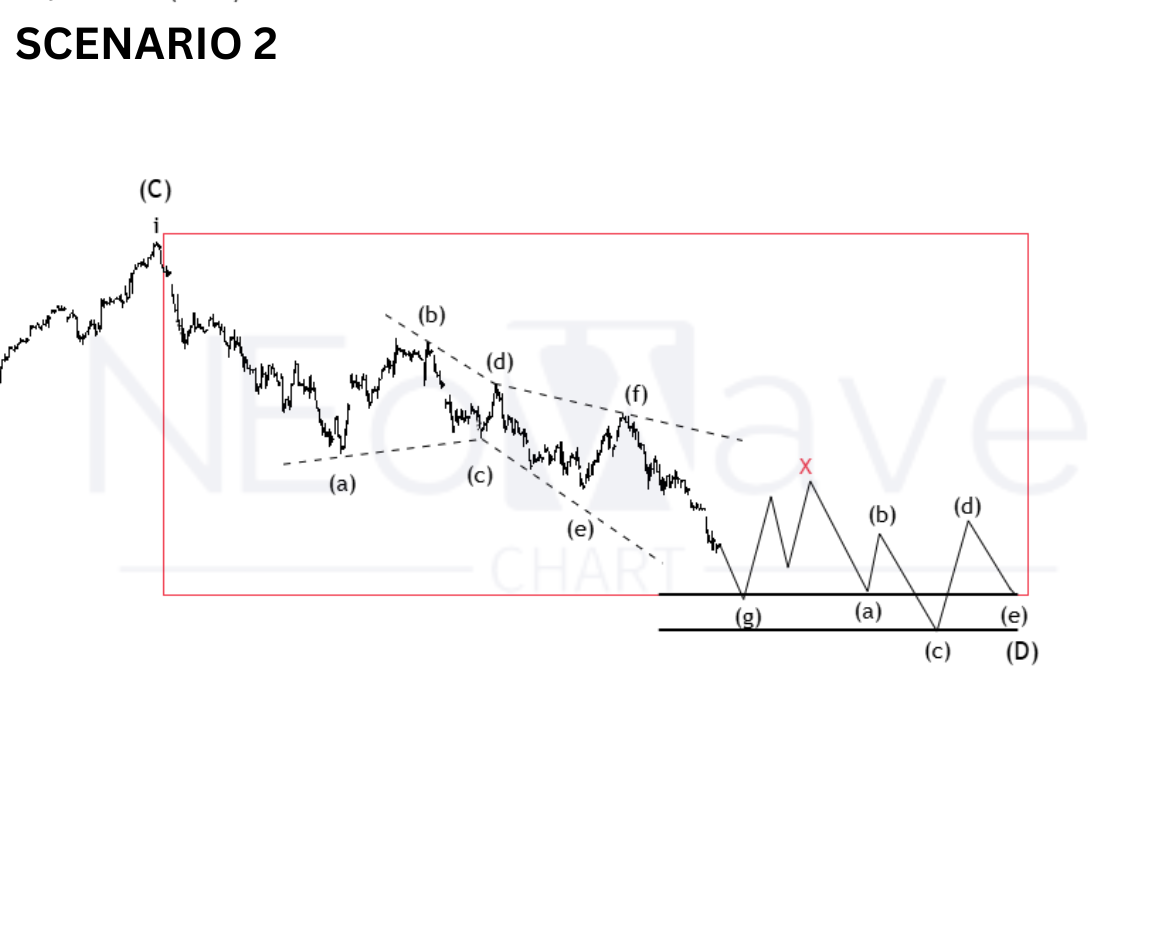
On the 2H timeframe, the recent price correction appears to be a diametric one. When a Diametric Zigzag forms, it usually forms a combination pattern, so we consider 2 scenarios:
Scenario 1
Diametric wave-(g) ends in the range of 21050 – 21473 or even higher and the upward movement begins
Scenario 2
a- Wave-(g) continues to the range of 21050 – 21473 and then, in order to complete the time correction, a combination pattern of Diametric – X – Triangle is formed on the support range.
b- Wave-(g) continues to the range of 21050 – 21473 and then a small X wave is formed, but the price crosses the support range of 21050 – 21473, in this case, the combination pattern will still form, but the price can decrease to 19993 or the price range of 18993-18744 according to the second pattern.
The second scenario is more likely to form.
Good luck
NEoWave Chart
Disclaimer
All wave counts, analyses, and forecasts presented on this website are produced by NEoWave Chart and operate independently of NEoWave, Inc and www.NEoWave.com.
Our content is strictly based on the NEoWave methodology developed by Glenn Neely, adhering to his innovative techniques and principles.


