About Bitcoin
After Bitcoin ETFs were approved by the SEC, the price of Bitcoin rose almost 60% to $73,777. The market thought that the price of Bitcoin would go to $100,000 without correction, but contrary to the market’s expectation,the Bitcoin price was in a correction phase for 6 months, and after almost 6 months and the re-election of Trump as President of the United States, Bitcoin returned to its upward trend.


Bitcoin Forecast by NEoWave(Update)
In the previous analysis, I said that we seem to be in wave-(e) of D. We considered wave-D as a diametric, which seems to have ended with the drop in Bitcoin price and we should consider the diametric to be over and change the labeling a little. Currently, considering what happened, we have two scenarios:
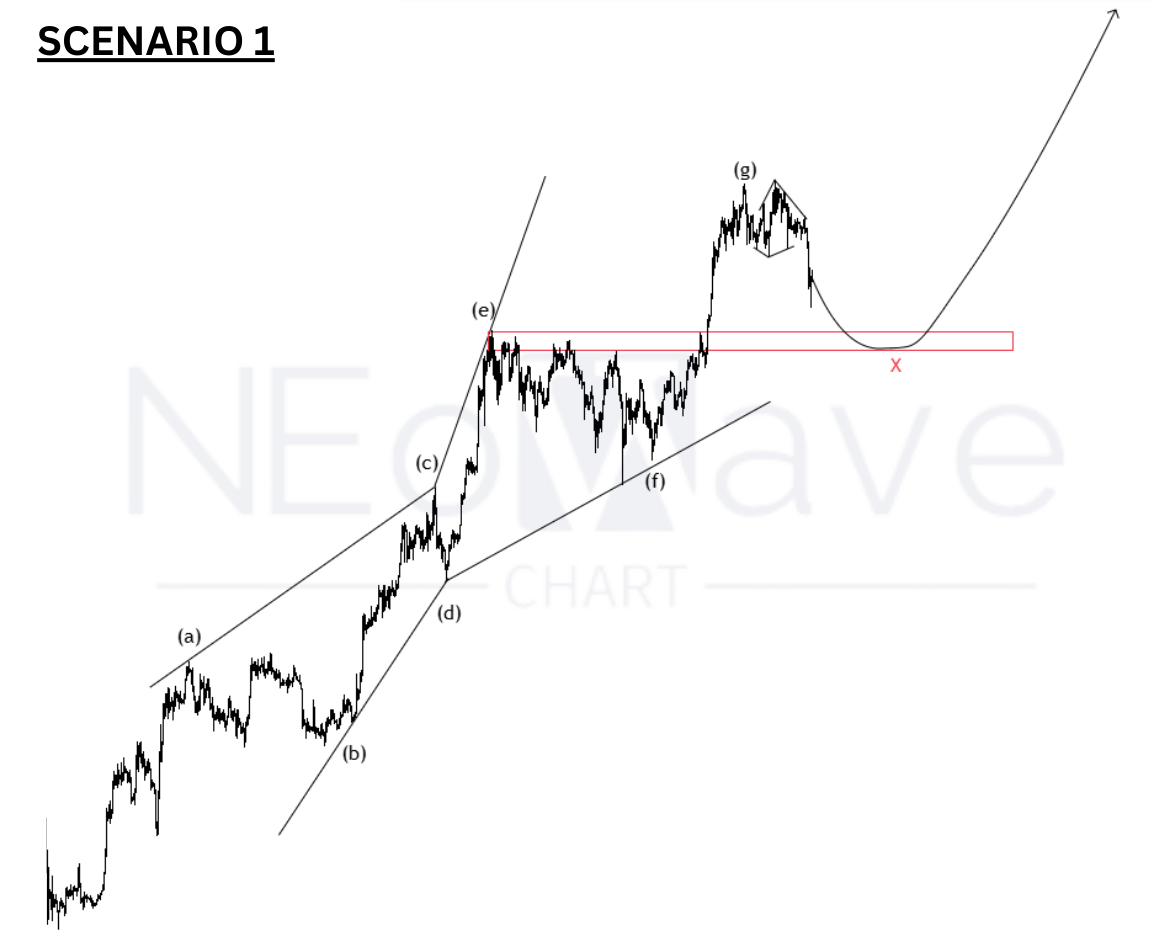
Scenario 1
In this scenario, if the Bitcoin price is maintained above $70,000, there is a possibility of a double combination pattern, the second pattern will probably be a Diametric or Neutral Triangle or a Reverse Contracting Triangle, and wave-D (higher degree wave) will continue. In this case, the price could touch $150,000.
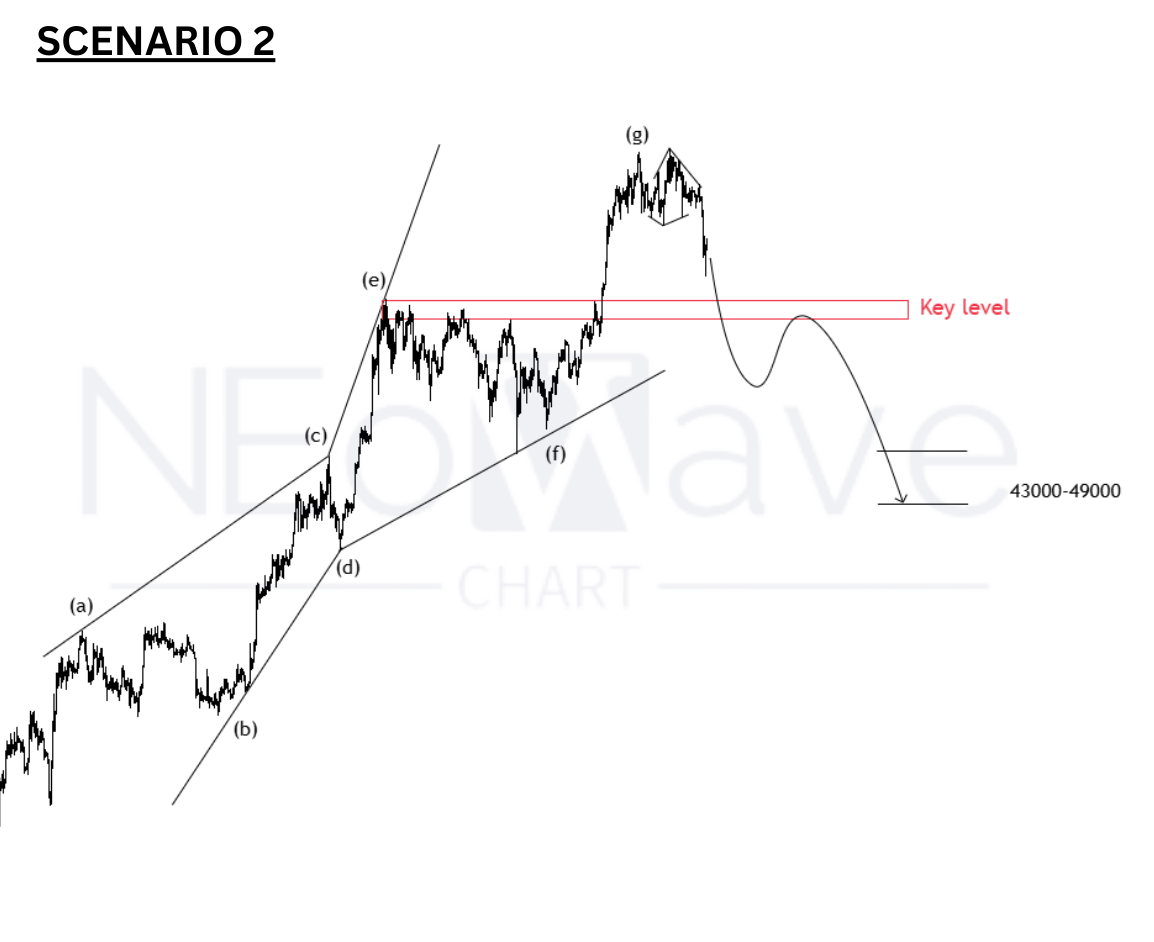
Scenario 2
In this scenario, if the price goes below the key level of $70,000, we should consider wave-D to be over and the price could decline to the range of $49,000-43.00 and wave-E will be completed.
Good luck
NEoWaveChart
Disclaimer
All wave counts, analyses, and forecasts presented on this website are produced by NEoWave Chart and operate independently of NEoWave, Inc and www.NEoWave.com.
Our content is strictly based on the NEoWave methodology developed by Glenn Neely, adhering to his innovative techniques and principles.


