
Gold has always played the role of a safe asset in times of war and financial crises. The demand for gold is constantly increasing, especially in the last few years when central banks are increasing their gold reserves, which is the reason for the increase in financial and geopolitical crises.
In MY PREVIOUS ANALYSIS I said that the price is moving towards the 2793-2864 range and upon reaching the 2793-2864 range, the price dropped to $2536.
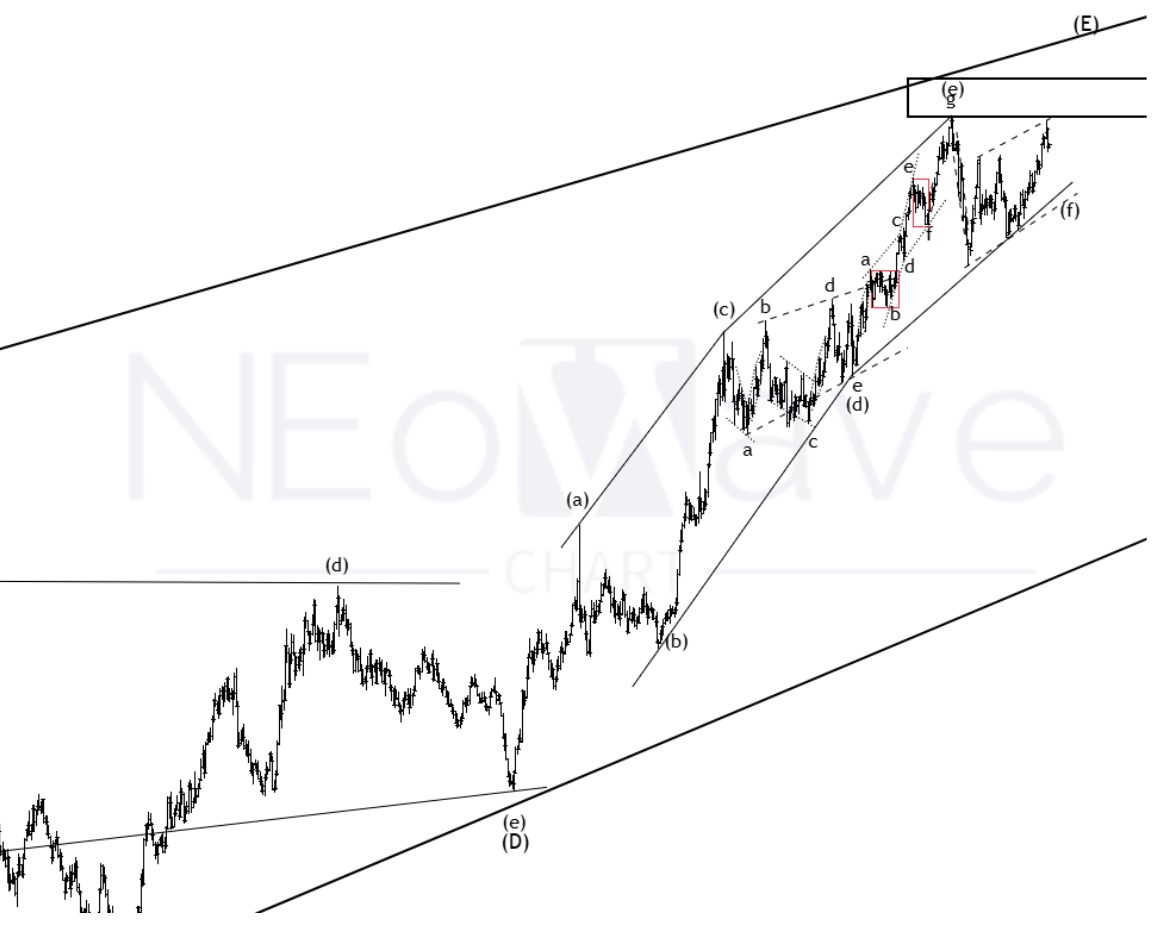
Looking at the DXY chart and the time of wave-(d) from wave-(E), it seems that wave-e from wave-(f) is forming and we still think that gold price will have at least one more growth in the form of wave-(g) from wave-(E) and can rise to the $2820-3000 range.
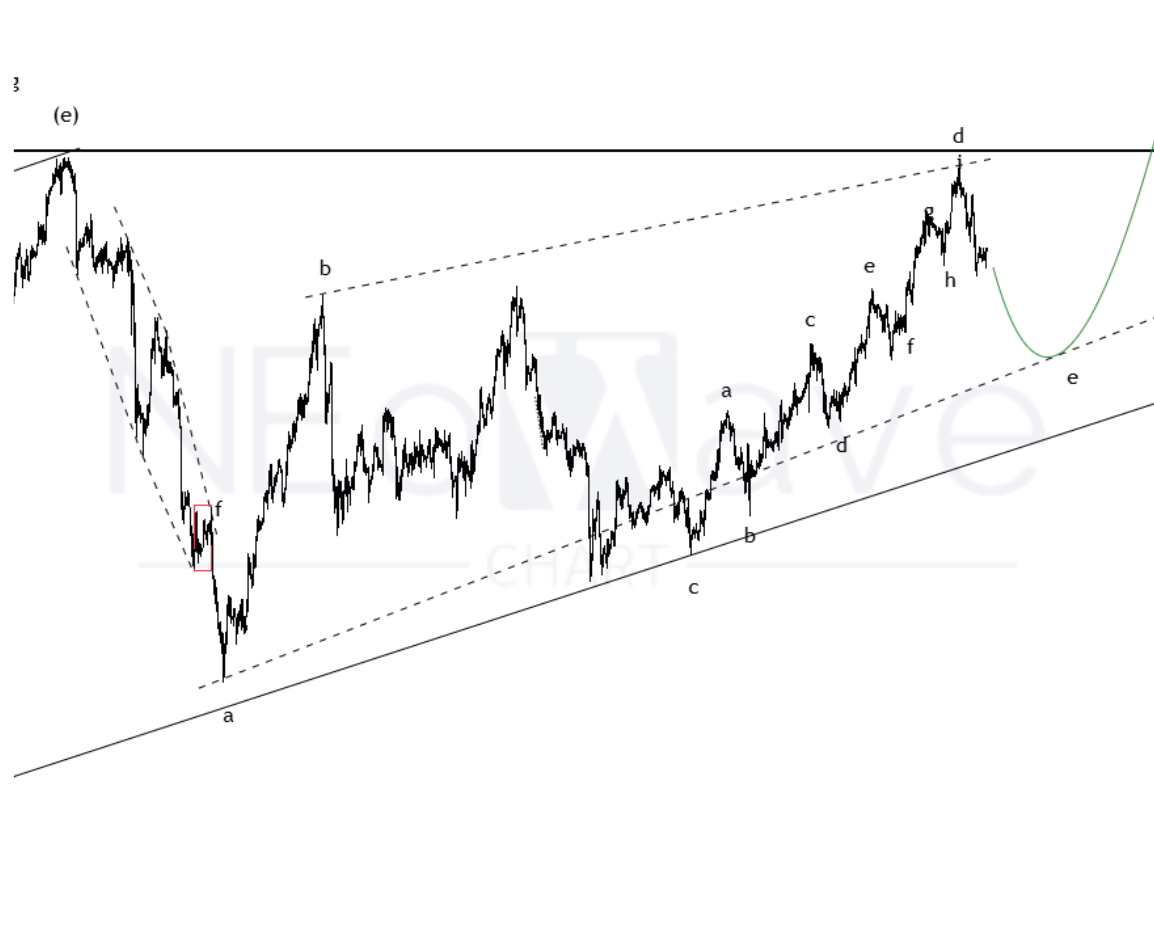
There is a possibility that wave-(f) will resemble wave-(d), that is, it will turn into a Reverse Triangle and we expect the price to reach the range of $2820-3000, after which we expect wave-(F) to begin a correction that:
– In terms of time, it can take between 2 and 3 years
– In terms of price, in a normal situation, it can fluctuate between $2600-2450 and in a pessimistic situation, it can decrease to $2200.
When wave-(E) is complete, we can more accurately predict the end of wave-(F).
Good luck
NEoWaveChart