About Bitcoin
After Bitcoin ETFs were approved by the SEC, the price of Bitcoin rose almost 60% to $73,777. The market thought that the price of Bitcoin would go to $100,000 without correction, but contrary to the market’s expectation,the Bitcoin price was in a correction phase for 6 months, and after almost 6 months and the re-election of Trump as President of the United States, Bitcoin returned to its upward trend.

Bitcoin Forecast by NEoWave(Update)
Previous Bitcoin analysis confirmed
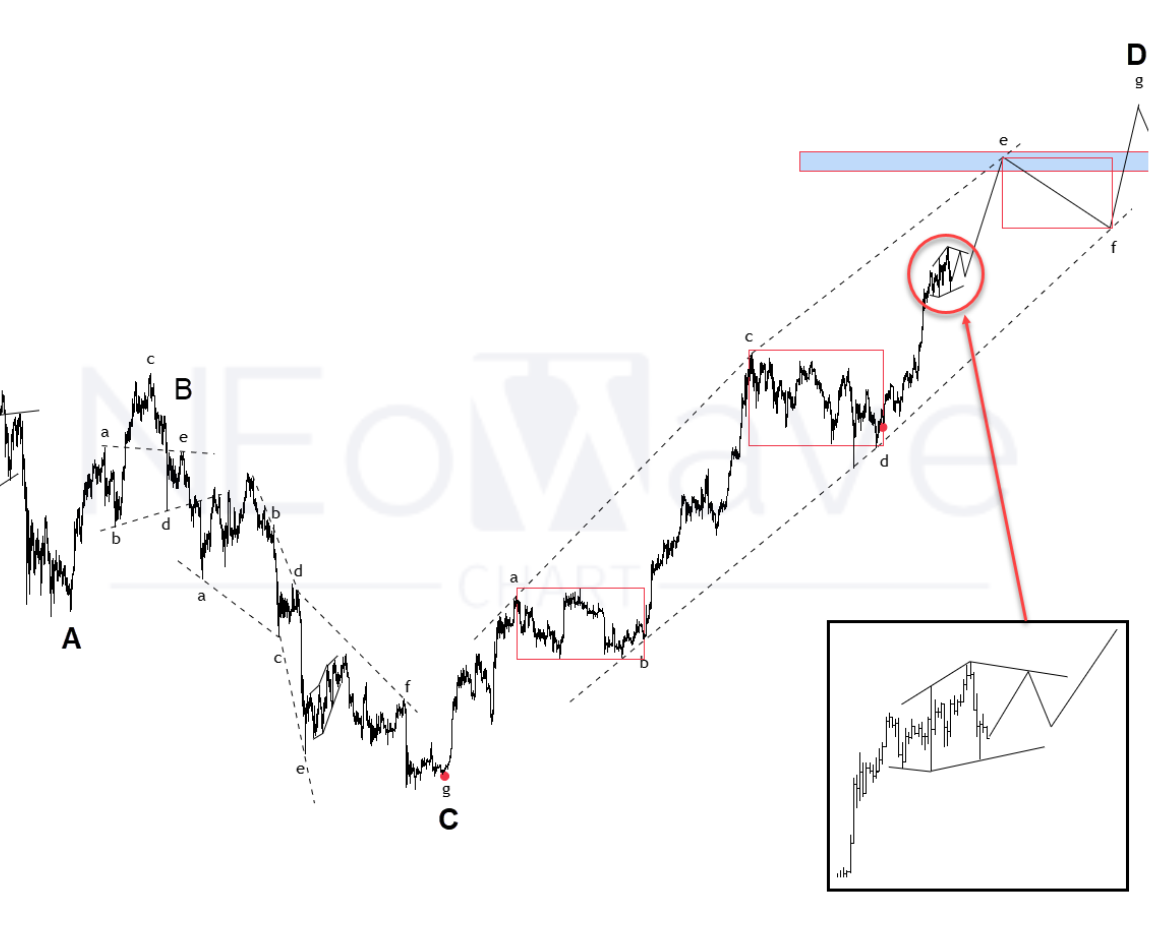
In previous analyses, I had said that Bitcoin was forming a Neutral Triangle as a higher degree pattern and the neutral triangle was confirmed by breaking the B-D trend line, but considering the waves that formed, it seemed that I should make a slight change in the wave counting.
In the previous analysis, I had considered wave-C as a double pattern (Flat – X – Reverse Contracting Triangle), but it seemed to have a degree problem, so in the new analysis, I considered wave C as a bowtie diametric. After wave C, you can see that the waves have similar time and price, so it seems that wave D will be a diametric.
Conclusion:
It is now clear that we are in wave-e of D, this wave can continue to the range of $ 143,000-150,000 (currently wave-e is in a short-term corrective phase in the form of a diamond diametric, which can fluctuate for a short time between the range of $ 92,000-108,000 and then move towards the mentioned targets. these targets will be achieved if the price breaks the important range of $ 100,000-110,000.
After the completion of wave-e Bitcoin will enter wave-f, which can decrease to the price range of $100,000-115,000 and spend 3-5 months and then move towards $ 180,000.
The higher degree pattern can still be a Running Neutral Triangle but it is too early to draw conclusions about the higher degree pattern.
Good luck
NEoWaveChart
Disclaimer
All wave counts, analyses, and forecasts presented on this website are produced by NEoWave Chart and operate independently of NEoWave, Inc and www.NEoWave.com.
Our content is strictly based on the NEoWave methodology developed by Glenn Neely, adhering to his innovative techniques and principles.


